
The City of Edmonton’s Fleet Analytics and Strategic Technology team in Canada has introduced a state-of-the-art analytical tool to assist with the maintenance of the city’s 5,000-strong vehicle fleet. Edmonton’s Colleen Kroening and Steve Rapanos talk about how FAST’s strategic management and reporting capabilities have streamlined data management and improved overall business performance. Matty Flores reports.
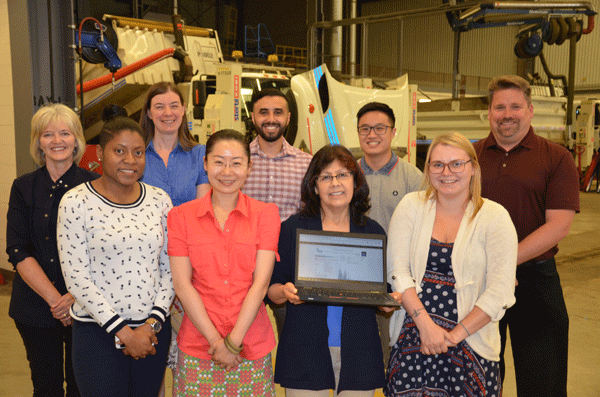
Technology is making it easier to collect and manage large amounts of data. For the City of Edmonton’s Fleet Analytics Supervisor Colleen Kroening and her team, this information is extremely useful for managing the city’s vehicles.
Colleen compares the new technology to a smartwatch, which provides a tool by which users can manage their health. With a click of a few buttons, a smartwatch allows users to track their heartbeat over a specific timeframe using simple graphics. From this data, users can determine if their pulse is in a healthy zone, identify any peaks and valleys in heart levels, and monitor other factors.
‘FAST is just like the data from a smartwatch except that we use it to determine the overall health and well-being of vehicles,’ says Colleen.
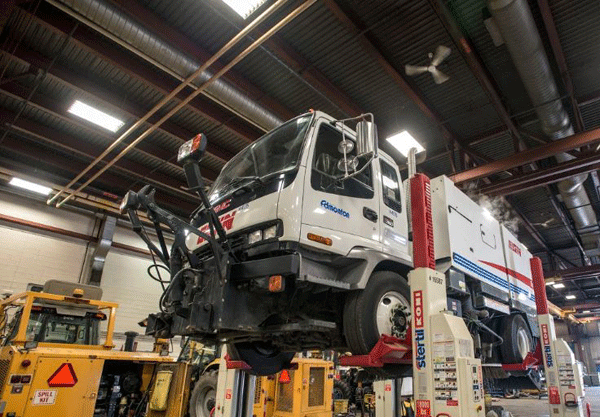
The City of Edmonton’s Fleet and Facility Services is led by Branch Manager Steve Rapanos and is one of the largest integrated municipal fleet operations in Canada. ‘We manage a diverse fleet and associated infrastructure that includes more than 5,000 vehicles and a variety of equipment,' Steve explains. 'We also manage more than 900 city facilities such as recreation centres and City Hall. Fleet and Facility Services is the city’s expert in vehicle and equipment procurement, maintenance, fleet engineering, fabrication services, fuel management, and fleet safety. We also serve external clients for the province and regional areas by managing their fleet maintenance.’
Prior to the introduction of FAST, gaining a complete picture of the status of a vehicle was a time consuming and labour intensive process. ‘Before FAST, it took us longer to analyse data on a unit and we had to go through a variety of channels,’ says Steve. ‘Now we are able to quickly blend a variety of information streams together to obtain a complete story on a vehicle, which enables us to be more proactive. Developing FAST took a lot of time, but now we can access and share data very quickly and the system has helped improve our client relationships and aided in the decision-making process.’
In 2008, there was a major business transformation project that saw a dramatic change in how Fleet and Facility Services was run, both strategically and operationally. Steve Rapanos explains that the impetus for change was an audit that identified a number of business issues and suggested areas of improvement to focus on. Since the audit results, the organisation has undergone a series of business transformations, including the implementation of a new fleet management system, real-time insight into work requests/order status and overall workload, and the creation of standardised processes across the organisation.
Although tremendous headway has been made in these key areas, there were still information system challenges that needed to be addressed in order to support continued growth and business transformation. ‘We made significant progress, but we still had to continue improving and evolving,’ says Steve.
The primary areas that needed to be addressed included:
• Reliance on manual data processes
Source information systems were not intuitive and extracting information was time-consuming and prone to error.
• Limited functionality to create new reports and Key Performance Indicators
Creating, searching for, and compiling information consisted primarily of Excel spreadsheets.
• The difficulty of conducting ad hoc operational and financial analysis
Specialised knowledge was required to acquire data and transform it into useful information for KPIs and other reports.
• Redundancy of information
Information was scattered between many spreadsheets and didn’t reside in a single application or data store.
• Data quality and auditability
Limited data validation and control once information was published in Excel spreadsheets.
With advancing technology, the organisation adopted a new approach to information management by implementing best practices in relevant business intelligence technology. This helped to efficiently monitor key operational activities, and better assess and gain insight from information systems, thereby improving the overall fleet operational effectiveness.
This led to the development of the Fleet Analytics and Strategic Technology (FAST) tool. This was designed to reduce the amount of time that it takes to prepare routine data, increase the amount of access to that data with user-friendly tools, and to ensure that everyone is working from the same set of data.
What does FAST do?
• Provides reliable information in near real-time through an accessible and easy-to-use web-based information solution.
• Provides a single source of information.
• Facilitates data drill down for insight into issues and root causes.
• Enhances decision-making capabilities.
• Creates better alignment of employees with the organisation’s business objectives.
• Improves the visibility and transparency of data through efficient monitoring of leading performance indicators.
• Provides employees with enhanced tools.
• Provides better insight into daily business operations.
• Improves collaboration and engagement of employees, partners, and clients.
‘Our analytics team used to spend the majority of their time collecting and preparing data with little time for analysis,’ explains Colleen Kroening. ‘With FAST, we’ve gone through a complete reversal and now we maximise our analysis time.’
FAST helps find anomalies and patterns and expresses data in images and graphical format. The tool allows the organisation to see what’s trending, what’s going well, and what needs improvement. A key benefit is the ability to blend information together, and how data integrates together to tell a complete story of a vehicle.
Fleet count and age
Among the key reports generated by the system are fleet count and average age. The internal dashboard enables the team to analyse units in a myriad of ways – by asset class (light, medium, or heavy fleet, self-propelled fleet etc), by fleet status (within the lifecycle, outside lifecycle, in consideration for disposal), etc.
‘We use the meta tags on the data to allow for meaningful analysis,' explains Colleen. 'The dashboard updates the average age of the fleet based on the user’s selection criteria.'
‘The customer dashboard allows the client to do a similar drill down, specific to their fleet. Some customers have internal coding in our fleet system, which enables them to filter their data based on their criteria. Now clients gain access to their own information without having to engage our analytics team. This improves customer service 24/7.’
Fleet availability
Fleet Availability is another report requested on a regular basis (at least monthly for internal reporting). This dashboard represents very complex calculations that can easily be staged incorrectly when calculated manually. Logic components include, for example, multiple work orders with overlapping downtime and unit shifts. The customer dashboard provides the opportunity for the user to drill down to groups of units specific to their area, where they can see availability by year-over-year, by the month or even by the week.
Fuel consumption and unit usage and fuel economy
Fuel consumption and unit usage are also frequently-generated reports, which the analytics team produced manually prior to FAST.
‘Analysis from the previous Excel spreadsheets was limited,’ says Colleen. ‘In the fuel consumption dashboard we can now see the trends for fuelling – by unit grouping, by day of the week, by hour of the day, etc – and we can also see this same data by type of fuel. With unit usage, we can see the usage from an annual or monthly perspective, as well as the average usage per unit, annually and monthly. The filtering functionality allows us to separate kilometre-based reporting from hourly-based reporting at the click of a mouse.
‘FAST has allowed us to merge data from multiple sources,’ adds Colleen. ‘We can easily identify anomalies with the “scatter plot” functionality, and from there we can drill down into the unit details, enabling us to determine specific research, on specific units, in our fleet maintenance system.’
Overall, the introduction of FAST has brought numerous benefits to the City of Edmonton fleet team. As well as automated updates and 24/7 access to information for the analytics team, customers also have access to their own information. The results are consistent and reliable and the time it used to take to gather data manually is now more productively spent on other tasks.
The system also makes it possible for the city to monitor trends over the years and drill down into any units that require further investigation. Data can be analysed in different ways and dashboards augmented to improve analysis. Finally, the system helps the team focus its efforts on analysis and storytelling, which has enabled the business to improve performance.